Metrics that Matter
Measuring What Drives Warehouse Performance
Most warehouse managers drown in data but starve for insight. We measure everything but understand little about what truly drives performance.
You're tracking dozens of metrics, generating daily reports, and attending weekly reviews. But when leadership asks the simple question "Are we actually getting better?" you find yourself scrambling through spreadsheets instead of confidently answering.
This post will help you identify the essential metrics that actually predict and drive warehouse success, plus show you how to implement a sustainable measurement system.
As I discussed in my post on process improvement fundamentals, before you can improve any process, you need to measure what matters. But here's the challenge: most of us are measuring too much of the wrong things.
The Metrics Trap: Why Most Systems Fail
Every single day, I spent 30-40 minutes writing an end-of-shift handoff report. Pages and pages of data about equipment status, staffing levels, production variances, and dozens of other metrics that senior leadership mandated we track.
Here's the thing: I never met a single person who actually read that report. Not one.
The information I actually needed to share with the next shift—safety concerns, equipment issues that needed immediate attention, staffing gaps—either wasn't included in the template or was buried so deep in the noise that it wasn't worth searching for it.
We all knew nobody read these reports, but we kept writing them because leadership required it. Forty minutes of my time every day, documenting metrics that changed nothing and informed no one.
This is the metrics trap: measuring everything means understanding nothing.
Just like root cause analysis helps us understand why problems occur, effective metrics help us predict and prevent problems before they become crises. But most warehouses track lagging indicators that tell you what already went wrong, not leading indicators that show you what's coming next.
What Actually Matters: The Foundation
Here's what I learned managing operations: performance builds in layers. You can't achieve productivity without quality, and you can't achieve quality without safety.
During my time at Amazon, I watched facilities focus on throughput while ignoring their foundation. They'd hit their productivity targets for a few weeks, then suffer a safety incident or quality problem that wiped out months of gains.
When I led a safety improvement project that reduced injuries by 12%, something interesting happened: our productivity numbers improved too. Safer operations turned out to be more efficient operations. When people feel secure, they work with confidence instead of fear.
As I discussed in my post on success journals, documenting these improvements in real-time helps you see patterns like this. The Growth Documentation System I've made available for download includes templates specifically for tracking how foundational improvements translate to operational gains.
The Essential Framework: "The Big 5"
During my time as a ship dock manager, I discovered that while you can track hundreds of metrics, only five really mattered for my day-to-day success. These became my North Star for everything we did.
Here's what changed: I always knew what to talk to my team about. I always knew where to focus our improvement efforts. If a process change didn't improve one of these five metrics, it didn't really matter.
Later, when I was managing hundreds of associates across three departments, these five metrics gave me the clearest picture of our operation's health. Everything else was just noise.
Safety: The Foundation Layer
Days Without Incident became our visible scoreboard. We posted it where everyone could see it, and it created momentum around safety culture. When we hit milestones, the whole team felt it.
Near-Miss Reporting Rate was my early warning system. When reports suddenly dropped from our normal 3+ per thousand hours to under 1, I knew we had a culture problem, not a safety improvement. More reports meant better awareness, not worse performance.
Quality: The Customer Connection
Delivery Estimate Accuracy (DEA) became my obsession because it directly predicted customer satisfaction. When DEA dropped below 99.5%, I knew we'd have complaint calls coming. When it stayed above 99.7%, customer feedback stayed positive.
Damage Rate caught problems before they became customer headaches. A damaged item in our warehouse meant a disappointed customer, a costly return, and a re-ship that ate our margins.
Productivity: The Flow Indicator
Throughput per Labor Hour was the only productivity metric I measured. While we recorded rates for each individual process and task, this metric told me about system performance, not just individual effort. When this number dropped, it usually meant we had bottlenecks, not lazy workers. Those granular process rates don’t matter one bit if the overall system flow isn’t working properly.
Each of these big five metrics had clear ownership, visible tracking, and direct connection to specific improvement actions. No mystery, no complexity.
Implementation: Making It Work
Start Simple, Scale Smart
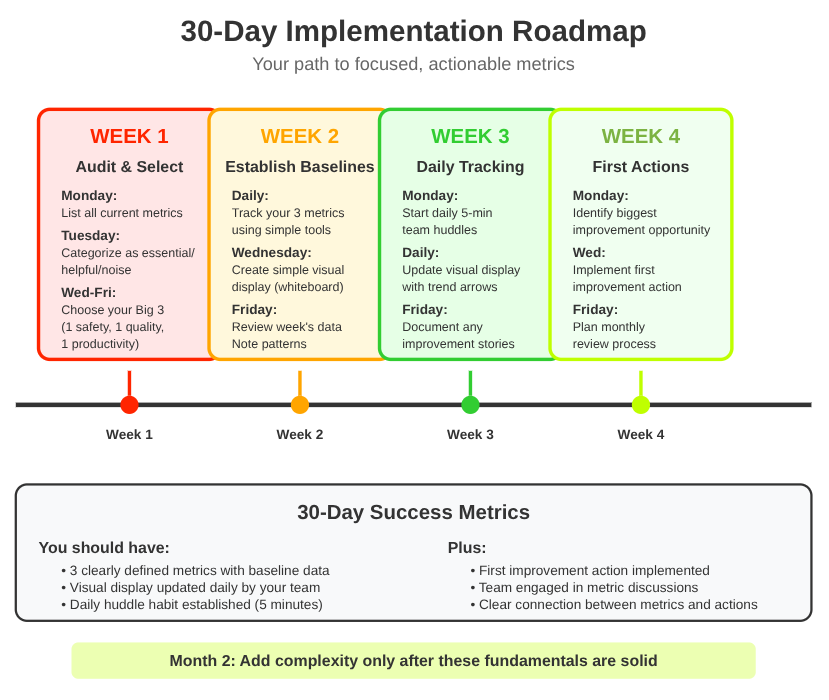
Begin with three metrics maximum—I learned this after overwhelming my team with too many changes at once. Build the daily conversation habit before adding complexity.
This connects perfectly to the real-time documentation approach I wrote about—capture the story behind metric changes so you learn what actually drives improvement.
Make It Visual and Accessible
An easy option is to use whiteboards and simple charts visible to everyone. If someone can’t understand your metrics in 30 seconds, they are too complex. No fancy dashboards, no training required.
Connect Every Metric to Action
As I outlined in my process improvement post, every metric needs an owner and a response plan. When throughput drops, what specific steps will you take? When safety incidents spike, who investigates and implements changes?
This is where focused metrics become powerful: your team knows exactly what behaviors drive the numbers that matter.
Common Pitfalls to Avoid
The "Metric of the Month" Problem: Stick with your chosen metrics for at least 90 days. Consistency builds habits and reveals trends.
Gaming the System: People optimize for what you measure. I once focused on tracking individual employee rates and watched quality plummet as people rushed. Always pair productivity metrics with quality metrics.
Analysis Paralysis: Don't wait for perfect data. Start with simple, directional metrics and refine as you learn what drives results.
From Theory to Action
The difference between having metrics and improving performance lies in consistent implementation. Here's how to get started this week.
1. Audit Your Current Metrics - List everything you currently track and ruthlessly categorize as essential, helpful, or noise. Most operations track 10x more than they need.
2. Choose Your Starting Three - Pick one safety, one quality, and one productivity metric. Focus on metrics where you have direct control over improvement actions.
3. Establish Baseline Measurements - Collect two weeks of data before making changes. Use simple tools—spreadsheets, paper logs, basic tracking systems. Don't invest in complex software until you've proven the metrics drive behavior.
4. Create a Simple Visual Display - Use a whiteboard or simple chart visible to your team. Update it daily. Include trend arrows and brief notes about what influenced changes. Context makes metrics meaningful.
5. Schedule Daily Metric Reviews - Hold 5-minute team huddles focused on yesterday's performance. Don't skip these—consistency builds the improvement habit. Ask three questions: What happened? Why did it happen? What will we do differently today?
6. Document Improvement Stories - Use the Growth Documentation System to capture what works. Note which actions led to metric improvements and which changes had no effect.
7. Plan Monthly Metric Reviews - Assess whether metrics are driving behavior and results. Are people changing their actions based on the metrics? Are the metrics predicting problems before they become crises?
8. Connect Metrics to Recognition - Celebrate improvements, not just achievements. Recognize the team member who identified why DEA dropped and implemented a solution, not just the person with the highest individual productivity. Documenting these wins as they happen ensures you can tell the complete story of your team's progress during performance reviews and when advocating for resources.
The managers who advance in their careers aren't the ones with the most data—they're the ones who use the right data to make better decisions.
Implementation starts with measurement. But measurement without action is just expensive record-keeping. Choose your metrics wisely, track them consistently, and use them to drive the daily decisions that compound into operational excellence.
Start with the Big 5, build the habits, and watch how clear focus transforms your operation. When you know what matters, everything else becomes much simpler.
Follow me on LinkedIn


